
Analyze in Query Dashboard
What is this feature?
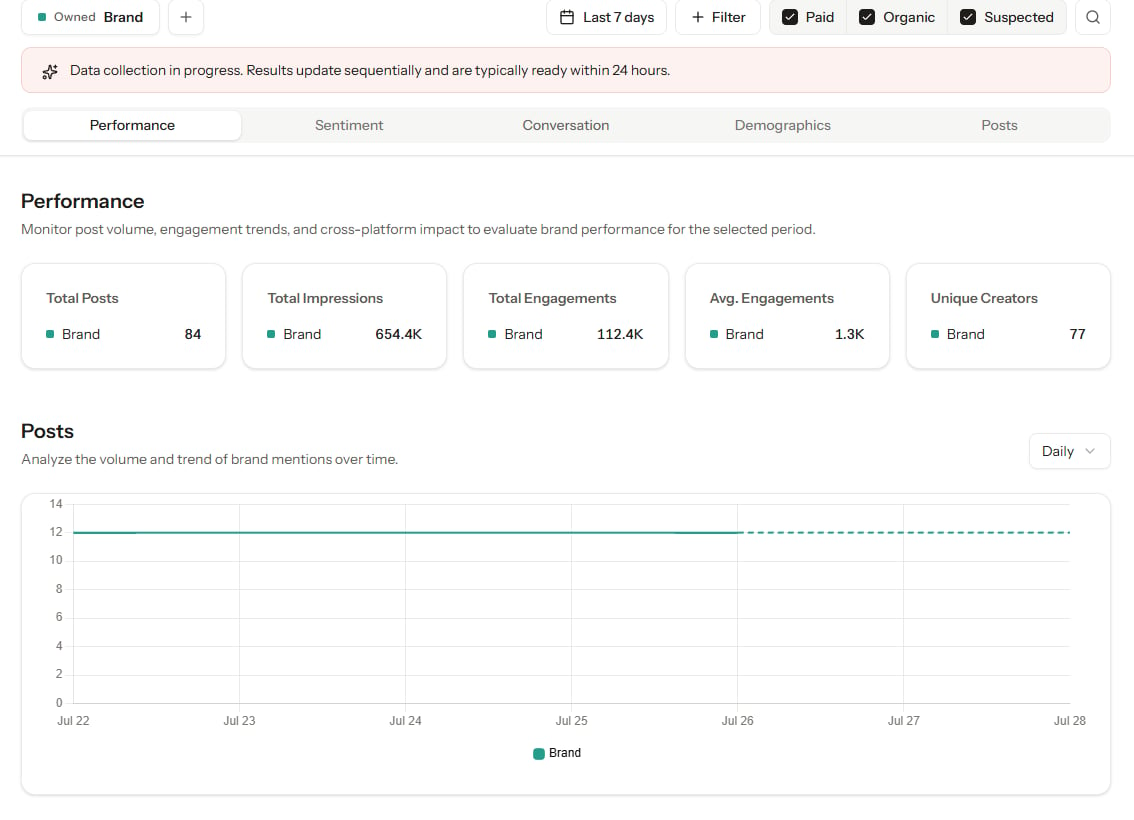
Query Dashboard is the analysis screen where you can review collection and analysis results for a created Query in one place. Tabs such as Performance, Sentiments, Content, Demographics, and Posts help you explore brand or topic performance and reactions.When should I use it?
- When you want to review results after creating a Query
- When you want to compare multiple brands or products
- When you want to analyze data with different conditions, such as date range, promotion type, or Structure Filter
- When you want to take a closer look at specific themes, sentiments, demographics, or posts
Before you start
- A Query must already be created.
- You need permission to view the workspace.
- Some results appear only after collection and analysis are complete.
How to use it
1. Open Query Dashboard
- Go to the Query list.
- Select the Query you want to analyze.
- When Query Dashboard opens, the selected Query is set as the default analysis target.
2. Select a tab
Refer to the product UI for the tab names shown on your screen.
3. Add comparison brands or targets
Requires at least 2 queries to compare.- In Dashboard, select the + in the upper left.
- Choose the target you want to compare from the candidate list for the same Query type.
- The selected target is added to selected brands in Dashboard.
- The default Query cannot be removed, but added comparison targets can be removed.
4. Adjust filters
Common filters are applied across multiple tabs.- Date range
- Promotion type
- Structure Filter
- Selected brand or comparison target
5. Open post details
- Select a post from the Content or Posts area.
- The post detail screen opens while preserving the Query context.
- The same Query exploration context is preserved when you move to the previous or next post.
Check the results
- Analysis cards, charts, and tables are displayed for the selected Query and tab.
- Results refresh after filters are changed.
- Query context is preserved when you open post details.